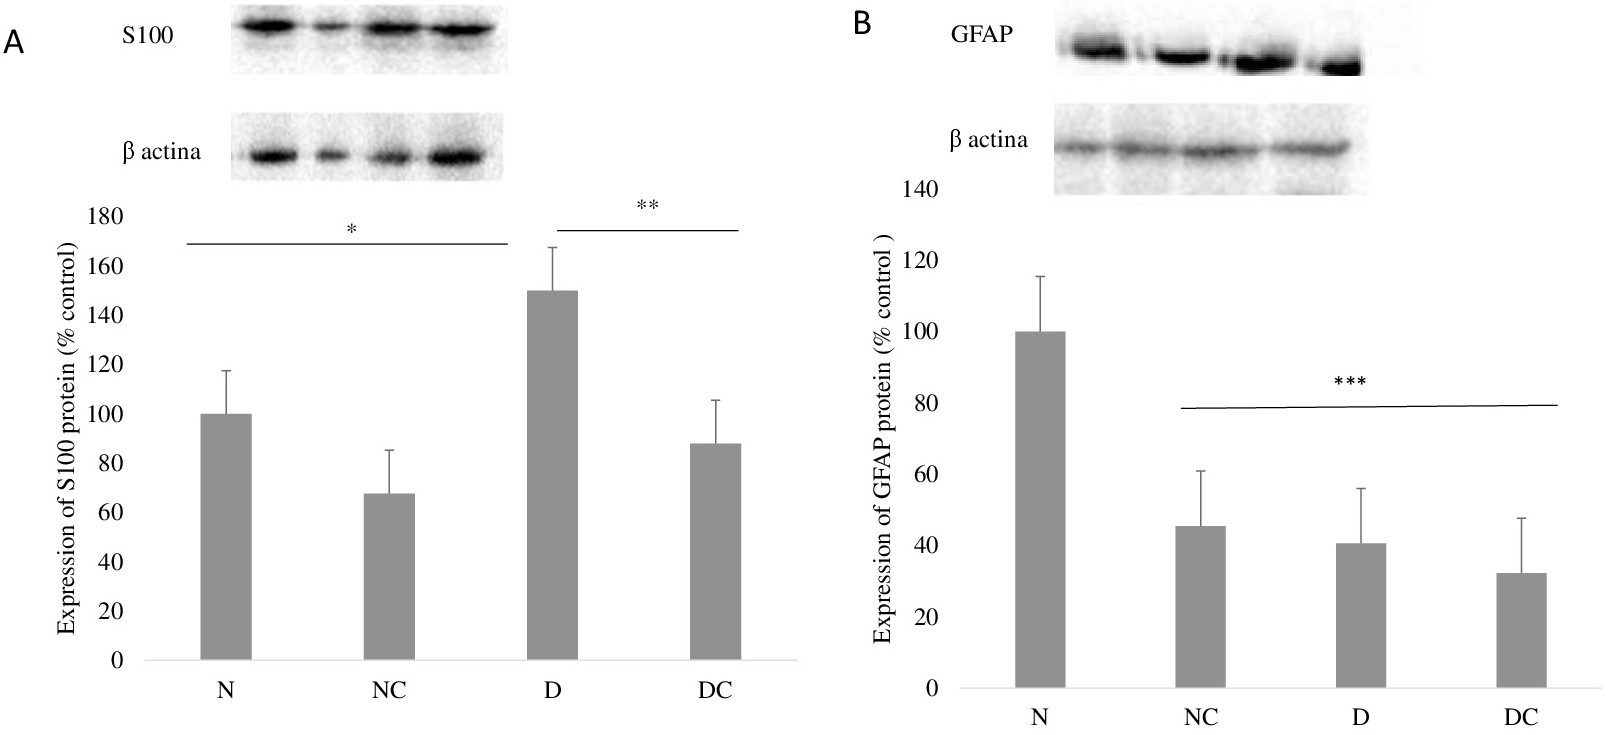
Fig. 3. (A, B) Expression of S100 protein and representative Western blot band (A) and expression of GFAP protein and representative Western blot band (B) in the N, NC, D, and DC groups. The results are expressed as mean ± SEM. n = 4 rats/group. *p<0.05, D group compared with N group; #p<0.05, D group compared with DC group; +p<0.0003, NC, D, and DC groups compared with N group.